Do you often create a home page in your Power BI reports?
If the answer is no, maybe it's time to rethink this detail.
Although it may seem like just a visual resource or a “nice cover”, the Home page has a much more strategic role: it centralizes the report entry point and organizes navigation, but most importantly, it directly impacts the way you interpret Usage Metrics from Power BI.
These usage metrics are available in the online service and show how users interact with each report: who accesses, how often, from where, and which pages are most visited. You can access it directly from the workspace, by right-clicking on the report and choosing “View usage metrics”.
And that's where the home page comes in: it absorbs incoming traffic, acting as an anchor. Without it, accesses may end up falling directly onto intermediate pages, distorting the reading of browsing data and making it difficult to analyze users' real behavior.
Have you ever stopped to think about this?
An anchor for your accesses
When you publish a report to Power BI Service, there is a page that will be opened first by default. If that home page doesn't exist (or worse, if you've set an internal tab as the first one), all incoming traffic will be attributed to that section. This directly affects how you read the data in the Usage Metrics report.
Imagine the following scenario: you have a report with several tabs (overview, details by area, monthly comparisons, etc.). If someone receives the direct link to the “Finance” tab, for example, and it is the default page for the report, all visits will appear as if they were organic accesses to that tab, and not coming from a specific redirect or click.
This can give the false impression that this page is the most consulted, when, in practice, it only became the entry “portal” due to the lack of a Home.
What should a good home page have?
It doesn't need to be anything super elaborate, but it must fulfill two essential roles:
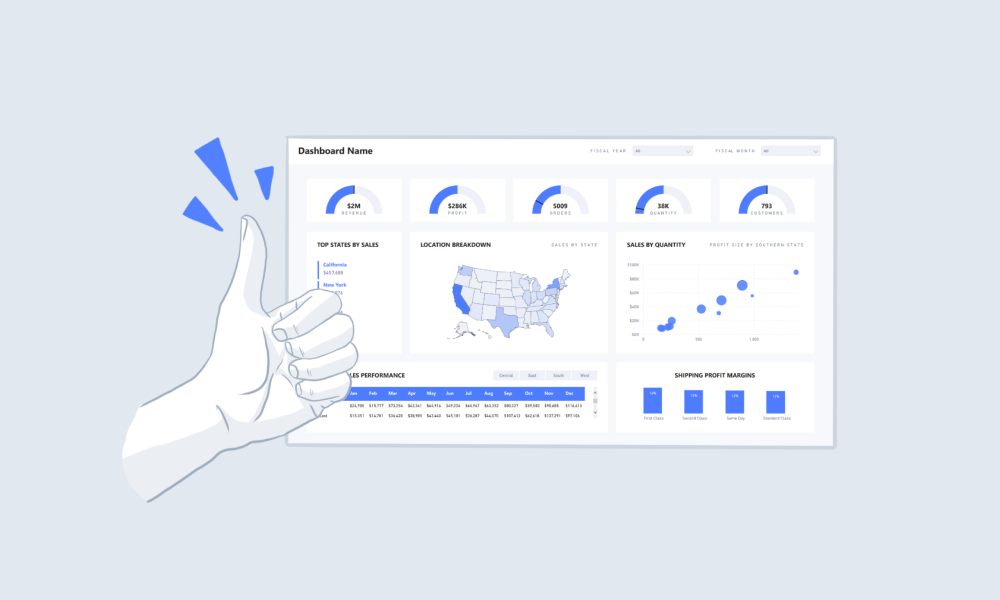
- Present the report – clearly stating the dashboard's name, purpose, target audience, and what can be found in the other tabs. Short, straightforward text goes a long way.
- Organize navigation – with buttons, links, or a simple menu guiding the user through the report pages. This reduces confusion and improves the user experience.
Furthermore, it is essential to include important operational information, such as:
- Data update date, preferably with a dynamic measurement
- Data source, when there are multiple origins
- Report version, if there are successive versions
And if you want to go further, you can set up a small changelog connected by a simple table in Power Query (or it could even be Excel) with records of the changes made: new tabs, revised filters, updated visuals. This improves communication with the user and organizes report maintenance..
In conclusion…
Reports with a good home page convey more clarity, better organize navigation and help to correctly interpret usage metrics. It's a simple detail, but which reveals maturity in the construction and maintenance of Power BI solutions.
And you, do you already have the habit of including a Home page in your reports, or have you realized that it could solve some of the problems that have been appearing in usage analyses?
If you want to exchange ideas about reporting structures, metrics or best practices in Power BI, I'm here.


Leave a Reply